Ever wondered how a single desert nation swings between sweater weather and sun-soaked extremes? The UAE’s climate dances between crisp 57°F winter mornings and summer afternoons hitting 106°F—sometimes within weeks. Whether you’re eyeing a desert safari or urban exploration, timing your visit around these shifts makes all the difference.
We’ve mapped out exactly what to expect each month, blending hard numbers with local know-how. From December’s golden-hour hikes to July’s strategic mall-hopping routes, this guide isn’t just about degrees—it’s your backstage pass to thriving (not just surviving) Emirates-style.
Here’s what we’ll unpack:
- Monthly climate patterns shaping desert adventures and city strolls
- Why daily lows matter as much as midday highs
- Pro tips for aligning your itinerary with seasonal sweet spots
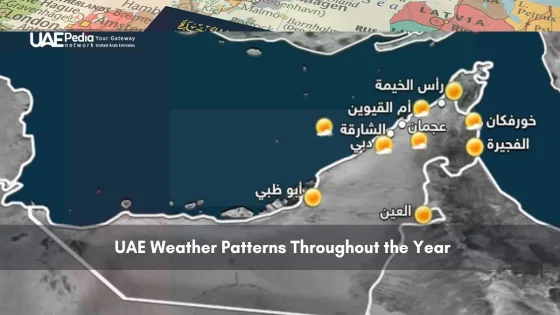
Understanding UAE’s Climate Overview
Picture this: a land where skyscrapers cast shadows over rolling dunes, and weather patterns shift like desert sands. The united arab emirates isn’t just hot—it’s a symphony of extremes, blending coastal breezes with oven-like desert heat. Let’s crack open what makes this place tick meteorologically.
Dubai’s Weather Statistics at a Glance
Dubai serves as the poster child for UAE weather quirks. From April to September, clear skies dominate 89% of days—ideal for rooftop cocktails but brutal for midday walks. Here’s the kicker: summer highs regularly hit 113°F, yet winter nights dip to a crisp 57°F. Don’t let the numbers fool you—local geography turns these stats into real-life adventures.
| Season | Clear Sky Days | Notable Feature |
|---|---|---|
| Winter (Nov-Mar) | 78% | Perfect desert camping |
| Summer (Apr-Sep) | 89% | Indoor attractions thrive |
| Transition Months | 68% | Sandstorm potential |
Seasonal Variations Across the Emirates
Drive two hours from Abu Dhabi’s corniche to Liwa’s dunes, and you’ll swear you changed continents. Coastal areas battle humidity spikes that make 95°F feel like 115°F, while mountain towns like Hatta enjoy cooler nights. Even summer has layers—June’s dry heat versus August’s sticky monsoon whispers.
Urban jungles trap heat differently than open deserts. Dubai Marina might simmer at 104°F while Al Ain’s oases hover near 97°F. These microclimates mean your weather app lies—pack accordingly.
Monthly Temperature Trends in the Emirates
December’s desert chill meets July’s asphalt-melting heat—how do you navigate this rollercoaster? The Emirates’ calendar reads like a thermostat war, with each month scripting its own thermal drama. Forget steady climates; here, your packing list needs split personalities.
Highs and Lows Throughout Each Month
January whispers sweet relief with daytime peaks around 75°F—perfect for dune bashing. Come August, concrete jungles like Dubai simmer at 106°F. But the real story? Nightfall in Ras Al Khaimah dips to 68°F mid-summer, while winter lows touch 58°F. These swings aren’t quirks—they’re trip-planning essentials.
| Month | Day Peak | Night Low | Vibe Check |
|---|---|---|---|
| March | 86°F | 70°F | Beach bonfire weather |
| June | 105°F | 84°F | Mall marathons |
| November | 90°F | 73°F | Rooftop sundowners |
Day vs. Night Temperature Comparisons
That “average” you see on apps? It’s math magic—halfway between daily extremes. A 95°F June day might plunge to 82°F by midnight. Pro tip: Schedule desert safaris at dawn when thermometers read 20°F cooler than midday. Coastal areas like Abu Dhabi hold heat longer, while Al Qudra’s sands lose it faster.
Ever packed a pashmina for a desert dinner? July nights still hover near 90°F, but December evenings demand light layers. These gaps shape everything from souk stroll times to poolside happy hours. Your itinerary’s success? It lives in these degrees.
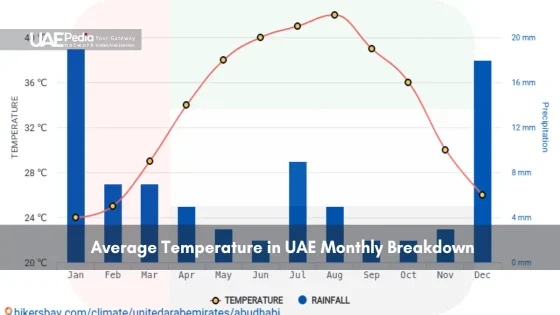
Average temperature in UAE: Key Data Insights
Meteorological charts might look like abstract art at first glance, but they hold the key to mastering the region’s climate rhythm. We’re breaking down how to translate squiggly lines and percentage points into real-world decisions—from choosing beach days to avoiding steam-bath evenings.
Reading Between the Temperature Lines
Those colorful graphs you see? They’re more than pretty visuals. The average figures blend daytime peaks and nighttime dips—crucial for planning. For example:
- A 104°F July day paired with 80% humidity feels like 127°F on your skin
- December’s 75°F reading gains 5°F warmth when cloud cover traps desert heat
Pro tip: Always check the spread between high/low markers. Narrow gaps (like March’s 16°F swing) mean stable days. Wide spreads? Pack layers.
When Moisture Steals the Spotlight
Here’s a desert paradox: August’s 90°F nights often feel hotter than midday. Why? Dew points above 70°F turn air into a wet blanket. As a local guide once told us:
“Our summer isn’t measured in degrees—it’s counted by shirt changes per hour.”
Use this humidity hack: If the “feels like” temp exceeds actual by 15°F+, seek AC or coastal breezes. Combine this with precipitation data—those rare rainy days can slash perceived heat by 20%.
Seasonal Shifts and Weather Patterns
Imagine trading your sandals for a light jacket—then swapping back before lunch. That’s life in the Emirates, where seasonal whiplash isn’t just real—it’s a cultural experience. Let’s decode what happens when winter’s gentle kiss meets summer’s fiery embrace.
Contrasting Winter and Summer Conditions
Winter here plays nice: think 58°F nights perfect for stargazing in Liwa’s dunes. But summer? It’s like someone left nature’s oven on max. Dubai’s thermometers regularly hit 106°F+ between June and August—enough to melt sidewalk gum in seconds.
The real magic lies in transitions. February mornings might start at 64°F, then leap to 82°F by noon. Locals joke about carrying sunglasses and scarves year-round—they’re not wrong. These rapid shifts demand wardrobe flexibility and timing smarts.
| Season | Day Strategy | Night Vibe |
|---|---|---|
| Winter | Sunrise desert hikes | Open-air markets |
| Summer | Museum marathons | Indoor theme parks |
Here’s your cheat sheet: November to March means outdoor everything—beach days, heritage tours, rooftop dinners. April onward? Embrace AC kingdoms and twilight adventures. As one Abu Dhabi resident told us:
“We don’t have spring—just ‘pre-sweat’ and ‘post-sweat’ phases.”
Pack for both extremes, and you’ll dance through seasonal changes like a pro. Light layers for winter evenings, moisture-wicking fabrics for summer’s peak heat—your suitcase becomes a climate-control toolkit.
Rainfall, Humidity, and Wind Analysis
Think desert and rain don’t mix? The UAE’s skies have a surprise in store. While rainfall here plays hard to get—averaging just 3-4 inches annually—its cameo appearances shape everything from wadi hikes to rooftop dining. Let’s decode where, when, and how these elements collide.
Distribution of Rainfall and Precipitation Trends
February steals the show with Dubai’s rainiest month (35mm), though you’ll still see more sand showers than water drops. Only 8-10 days yearly get proper rainfall—mostly quick bursts between December and March. Summer? Forget umbrellas. June-August see less than 1mm, making surprise downpours rarer than parking spots at Dubai Mall during sales.
- Rainy season: December-March (80% of annual total)
- Driest stretch: May-September (0-2 rainy days/month)
- Flash flood zones: Eastern mountains receive 140% more rain than coastal cities
Wind Speed, Direction, and Humidity Profiles
Three forces rule UAE’s airspace: shamal winds (northwest gusts up to 40mph), sea breezes battling desert drafts, and humidity that turns July into a steam room. Coastal areas like Abu Dhabi endure 80-90% summer humidity, while inland deserts swing between 15% (day) and 50% (night).
| Season | Avg Humidity | Wind Direction | Impact |
|---|---|---|---|
| Winter | 55-65% | Northwest | Cooler nights |
| Summer | 75-90% | Southeast | Sandstorm risks |
Pro tip from a Dubai meteorologist:
“Check wind maps before desert trips—15mph+ winds turn dune picnics into sand exfoliation sessions.”
Pair this intel with humidity charts, and you’ll master the art of timing outdoor adventures between sweat-inducing spells.
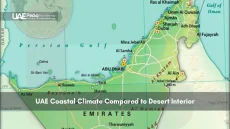
Coastal vs. Inland Temperature Variations
Want to escape Dubai’s sidewalk-melting heat without leaving the Emirates? The answer lies in geography. Coastal areas like Jumeirah Beach enjoy sea breezes that slice through summer’s edge, while inland deserts and cities bake under relentless sun. Here’s why location changes everything.
The Arabian Gulf acts as nature’s AC—August waters hit 92°F, creating a buffer that keeps beachfront zones 5-8°F cooler than downtown Dubai. But venture 60 miles inland to Al Ain, and you’ll find thermometers climbing 10°F higher than the coast. Urban areas add another twist: concrete jungles trap heat 24/7. As one resident joked:
“Our city streets at midnight feel like someone left the oven on ‘keep warm’.”
Check these contrasts:
| Location | July Day Peak | Key Feature |
|---|---|---|
| Abu Dhabi Corniche | 102°F | Sea breeze relief |
| Dubai Downtown | 110°F | Urban heat island |
| Liwa Desert | 116°F | Radiation baking |
Smart travelers use this knowledge like a secret weapon. Summer visits? Stick to the coast for tolerable evenings. Winter adventures? Head inland where desert nights get properly crisp. Pro tip: Book waterfront hotels June-September—their pools and sea access turn scorching days into staycation wins.
Remember: that thin blue line on the map separating sand from surf isn’t just geography—it’s your comfort zone.
Best Times for Outdoor Activities and Tourism
When does Dubai’s coastline transform from ‘toasty’ to ‘just right’? The secret lies in decoding tourism scores—a blend of sunshine, humidity, and crowd levels. Think of these ratings as your personal weather concierge, pinpointing when desert adventures and beach days hit their sweet spot.
Tourism and Beach/Pool Score Analysis
April’s golden hour isn’t just for photographers. With tourism scores hitting 9.2/10, this month delivers 12 hours of daylight and zero rain days—perfect for snorkeling in Fujairah or sipping sundowners at Atlantis. Mid-October through November follows close behind, offering warm waters (84°F) without summer’s sticky grip.
Beach scores consider more than just heat. They factor in:
- UV index (aim for 6 or below)
- Wind speeds (under 12mph for calm seas)
- Sand temperature (yes, it’s measured!)
Planning Your Trip Around Optimal Weather
Smart travelers treat UAE’s climate like a theme park FastPass. Book desert safaris for November mornings when thermometers read 82°F—cool enough for camel rides, warm enough for Instagram-worthy lighting. As one Dubai tour operator advised:
“Arrive by 7 AM in April; you’ll beat both the heat and the selfie-stick crowds.”
| Activity | Peak Window | Pro Tip |
|---|---|---|
| Beach Clubs | Mar 15-Apr 30 | Pre-book shaded loungers |
| Dune Bashing | Oct 20-Nov 30 | Sunset slots sell out first |
| Poolside Dining | Apr 1-30 | Happy hour starts earlier |
Pack flip-flops and light cardigans—even high-score months see 15°F dips after dark. Schedule waterpark visits for weekdays (30% shorter lines) and save museum hours for rare cloudy afternoons. Your perfect Emirates escape? It’s all in the timing.
Final Perspectives on UAE’s Weather Trends
Cracking the Emirates’ climate code isn’t about memorizing numbers—it’s reading between the lines. From desert starry nights to urban heat waves, this land thrives on contrasts. Let’s tie it all together with actionable intel.
Rain here plays coy—annual averages barely hit 4 inches, mostly clustered in winter. But as climate researchers note, even minor showers reshape landscapes. Terms like “perceived heat” (where humidity amplifies discomfort) prove crucial—a 95°F day can feel 20°F hotter near the coast.
Three rules for smart planning:
- Winter’s dry coolness (Nov-Mar) = outdoor everything
- Summer’s oven-like conditions demand AC havens and twilight adventures
- Transition months? Watch for sandstorms and pack layers
Use this guide like your personal weather whisperer. Whether chasing Liwa’s dunes or Dubai’s rooftops, aligning plans with seasonal rhythms unlocks smoother travels. The country’s magic lies in its extremes—master them, and you’ll dance through heatwaves and rare rains like a local. Stay curious, stay prepared, and let those desert sunsets reward your climate savvy!
We recommend November to March—think golden desert hikes and beach days without the summer sizzle. Temperatures hover between 24°C (75°F) and 30°C (86°F), perfect for dune bashing or exploring Al Ain Oasis. Just pack a light jacket for cooler evenings!
Coastal humidity can make 35°C (95°F) feel closer to 45°C (113°F)! Sea breezes help slightly, but from June to September, you’ll want air-conditioned escapes midday. Pro tip: Carry a reusable water bottle and seek shade during peak hours.
Absolutely! Inland regions like Al Ain can be 5°C (9°F) hotter in summer but cooler in winter. Coastal spots like Abu Dhabi have milder nights due to the Gulf’s influence. For mountain towns like Hatta, winter temps sometimes dip to 10°C (50°F)—pack layers!
Rain is rare but magical when it happens—mostly in winter (December–March). Dubai averages just 8 rainy days yearly, often quick showers. Flash floods occasionally occur in eastern wadis, so check forecasts if hiking near Ras Al Khaimah’s peaks.
Light, breathable fabrics like cotton or linen work year-round. In summer, UV-protective clothing and wide-brimmed hats are lifesavers. For mosques or cultural sites, carry a scarf for modesty. Shukran (thank you) in advance for respecting local norms!
Yes, but water temps vary! December–February averages 22°C (72°F)—refreshing for some, chilly for others. June–August, it’s bath-like at 33°C (91°F). Hotels heat pools in winter, so you’ll always find a dip spot.